6.1 Introduction and scope
In the year ending 31 December 2016, Victoria Police recorded 12,956 sexual offences across the state, with an offence rate of 214.0 offences per 100,000 people in Victoria. In five years the number of sexual offences has increased by 45.0 per cent, up from 8,936 offences in the year ending 31 December 2012.
Data for this spotlight has been extracted from the Victoria Police Law Enforcement Assistance Program on 18 January 2017 and reflects criminal offences and alleged offender incidents based on crime recorded by Victoria Police. The data covers a five year period from January 2012 to December 2016.
Sexual offences are defined as any offence recorded in LEAP that has been coded to the CSA offence classification category “A30 Sexual offences”, and includes the following offence groups:
- A31 Rape
- A32 Indecent assault
- A33 Incest
- A34 Sexual offences against children
- A39 Other sexual offences
Definitions for these offence groups can be found in the CSA offence classification located in the ‘About the data’ section at www.crimestatistics.vic.gov.au.
6.2 Prevalence of sexual offences
|
|
Jan – Dec 2012 |
Jan – Dec 2013 |
Jan – Dec 2014 |
Jan – Dec 2015 |
Jan – Dec 2016 |
% change 2015 - 2016 |
|
Number of sexual offences |
8,936 |
9,889 |
11,318 |
11,869 |
12,956 |
9.2% |
|
Offence rate per 100,000 population |
158.7 |
172.5 |
193.9 |
199.9 |
214.0 |
7.1% |
|
Alleged offender incidents |
2,828 |
3,034 |
3,237 |
3,281 |
3,859 |
17.6% |
|
Offender incident rate per 100,000 population |
50.2 |
52.9 |
55.4 |
55.3 |
63.7 |
15.4% |
In the year ending 31 December 2016, there were 12,956 sexual offences recorded. Indecent assault comprised 48.9 per cent of all sexual offences, followed by Rape with 34.1 per cent of all sexual offences. Sexual offences against children made up 10.1 per cent of offences, followed by Incest and Other sexual offences (3.7 per cent and 3.3 per cent respectively). The increase in the past 12 months was driven primarily by an 11.1 per cent increase in Indecent assault and 12.3 per cent increase in Rape. The only offence group to decrease was Sexual offences against children, decreasing by 15.9 per cent in the last 12 months (n=246).
There were 3,859 alleged offender incidents with a sexual offence as the principal offence, an increase of 17.6 per cent (n=578) from the year ending 31 December 2015. The alleged offender incident rate per 100,000 people is 63.7, a 15.4 per cent increase compared to the same period last year.
There were 7,788 victim reports for sexual offences recorded in the year ending 31 December 2016, an 18.3 per cent increase from the previous year (n=1,207).
Sexual offences recorded by offence group, January 2014 to December 2016

6.3 Trends over time
The graph below shows the number of sexual offences recorded each quarter from January 2012 to December 2016.
Number of sexual offences recorded, January 2012 to December 2016

Over the past five years, the number of sexual offences has continued to increase. The year ending 31 December 2014 saw the highest increase of 14.5 per cent (n=1,429). Offence groups A31 Rape, A32 Indecent assault and A39 Other sexual offences have all increased each year from 2012. Offence group A33 Incest has fluctuated over the past five years, and offence group Sexual offences against children experienced a 15.9 per cent decrease in the current reference period (n=246).
The increase in A39 Other sexual offences over the past two years is in part a result of the introduction of offences relating to threaten to or intentionally distribute intimate image of another person. These two offences made up 59.6 per cent (n=255) of this offence group in the year ending 2016.
Sexual offence incidents may comprise a high number of offences recorded for the one incident, as demonstrated in the spike in offence group A34 Sexual offences against children in 2015 which was the result of specific incidents with high offence counts.
6.4 Historical sexual offences
Changes to the numbers and rates of sexual offences recorded may in part be affected by increases in reporting of historical incidents of sexual offences, following the establishment of the Royal Commission into Institutional Responses to Child Sexual Abuse in 2013.
The historical sexual offences section below shows the proportion of offences recorded in 2016 that relate to sexual offences committed prior to 2016.
The majority of sexual offences recorded in the LEAP database in the year ending 31 December 2016 were recorded with a commit date within the past two years (60.2 per cent). A further 25.5 per cent of offences created in 2016 were recorded with a commit date prior to 2010.
Sexual offences recorded by period offence was committed, January 2012 to December 2016

In the year ending 31 December 2013 there were 19.9 per cent (n=1,963) of sexual offences recorded that were committed prior to 2000. Proportionally this was similar in 2014, with 19.8 per cent (n=2,2411) of offences recorded prior to this period.
The majority of offences recorded in the last five years, with a commit date prior to 2010, were recorded in a Residential location (69.1 per cent), Community location (13.4 per cent) and Other location (5.3 per cent). The remaining 12.2 per cent were recorded with an unknown or missing location type.
Just over half of offences which were recorded in the past five years and committed prior to 2010 were family incident related (51.2 per cent).
Alleged offender incidents by age of offender at the time the offence was committed, January to December 2016

In the year ending 31 December 2016, there were 3,859 recorded alleged offender incidents with a sexual offence as the principal offence.
Of the 778 alleged offenders that committed an offence prior to 2010, the largest age groups were 25–29 years (n=116) and 10–14 years (n=109) which together accounted for 28.9 per cent of offenders. The next highest age group was 30–34 years (n=107).
Of the 3,081 alleged offenders that committed an offence between 2010 and 2016, the highest age groups were 15–19 years (n=504) followed by 20–24 years (n=381) which together accounted for 28.7 per cent of offenders.
6.5 Sexual offences across Victoria
The Eastern region has had the highest number of sexual offences recorded for the past two years, followed by the North West Metro region. Western region has consistently had the highest offence rate per 100,000 population for the past five years. In 2016, the Local Government Areas with the highest number of recorded offences were Melbourne (n=659), Ballarat (n=569), Casey (n=555), Greater Geelong (n=469) and Latrobe (n=428).
Sexual offences rate per 100,000 by Local Government Area, January to December 2016
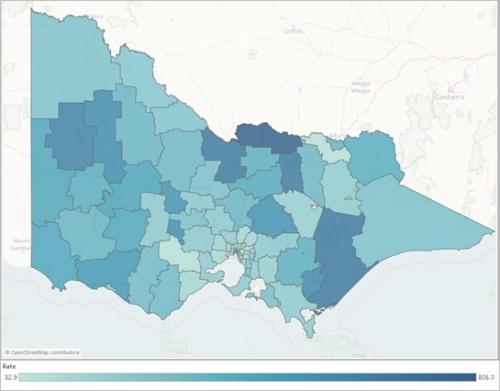
Accounting for population figures, the Local Government Areas across Victoria with the highest rate of sexual offences per 100,000 population were Moira (806.0), Campaspe (660.3), Wellington (659.3), Benalla (648.9) and Hindmarsh (618.5).
6.6 Location of sexual offences
Of the 12,956 sexual offences that were recorded in the year ending 31 December 2016, 66.0 per cent (n=8,546) took place at a residential location. A further 18.8 per cent (n=2,432) took place in a Community location, and 7.7 per cent (n=1,004) at an Other location. The remaining 7.5 per cent (n=974) had a missing or unknown location type.
The majority of offences were recorded with a location type of Dwelling - private, which made up 92.7 per cent of Residential locations, and 61.2 per cent of all location types. Community locations were most often recorded as Street/footpath 24.5 per cent (n=597), however this location type only made up 4.6 per cent of all sexual offences. A further 23.9 per cent (n=581) were recorded with an Education location, followed by Open space 19.0 per cent (n=461).
6.7 Investigation status of recorded offences
|
Investigation status |
Jan – Dec 2012 |
Jan – Dec 2013 |
Jan – Dec 2014 |
Jan – Dec 2015 |
Jan – Dec 2016 |
|
Arrest |
1,627 |
1,764 |
2,559 |
2,786 |
2,754 |
|
Summons |
2,727 |
2,956 |
3,700 |
3,240 |
3,146 |
|
Caution |
49 |
120 |
54 |
65 |
69 |
|
Other[1] |
2,035 |
2,240 |
2,096 |
2,561 |
2,826 |
|
Intent to Summons |
1,635 |
1,863 |
1,992 |
1,935 |
2,066 |
|
Unsolved |
863 |
946 |
917 |
1,282 |
2,095 |
|
Total |
8,936 |
9,889 |
11,318 |
11,869 |
12,956 |
Of the 12,956 recorded sexual offences, 16.2 per cent (n=2,095) remained unsolved as at 18 January 2017 when the data was extracted. There were 21.3 per cent (n=2,754) of offences that resulted in an arrest and 24.3 per cent (n=3,146) of offences resulted in a summons being issued.
The majority of offences recorded with an investigation status of Other were recorded as Complaint withdrawn (n=1,312) and No offence disclosed (n=1,339). Offences recorded with an investigation status of Complaint withdrawn and No offence disclosed made up 20.5 per cent of all sexual offences.
In the year ending 31 December 2016, 68.1 per cent of offences resulting in a Caution/warning were for the offence of intentionally distribute intimate image of another person.
Research into the attrition of sexual offence incidents across the Victorian criminal justice system was released by the CSA in February 2017, investigating the number of sexual offences that progress through from first being recorded by police through to being heard in court. This report can be accessed through the ‘Research and evaluation’ section at www.crimestatistics.vic.gov.au.
6.8 Family incident related offences
In the year ending 31 December 2016, 38.4 per cent of all recorded sexual offences were family incident related. Excluding offence group A33 Incest, the highest proportion of family incident related sexual offences was offence group A31 Rape with 42.3 per cent (n=1,867). Family incident related Rape offences made up 37.5 per cent of all family incident related sexual offences.
The offence group with the highest proportion of non-family incident related sexual offences in the year ending December 2016 was A34 Sexual offences against children with 87.6 per cent (n=1,142).
6.9 Alleged offender incidents
In the year ending 31 December 2016, there were 3,859 recorded alleged offender incidents with a sexual offence as the principal offence. This was an increase of 17.6 per cent (n=578) from the year ending 31 December 2015.
Of the 3,859 alleged offender incidents, 95.2 per cent (n=3,675) involved a male offender while 4.2 per cent (n=163) involved a female offender. The remaining incidents involved an offender with an unknown sex.
Of the 3,675 male offenders, the largest age groups were 15–19 years (n=447) and 20–24 years (n=426) which together accounted for 23.8 per cent of all male offenders. The next highest age group was 65 years and over (n=414).
Of the 163 female offenders, the highest age groups were 15–19 years (n=29) followed by 10–14 years (n=25) which together accounted for 33.1 per cent of all female offenders.
Alleged offender incidents by sex and age, January to December 2016

As at 18 January 2017, 47.4 per cent (n=1,829) of alleged offender incidents had resulted in an arrest or summons. Approximately half of alleged offender incidents were recorded with an outcome of Intent to summons (50.6 per cent or n=1,951). As Intent to summons is an interim status, this proportion tends to shift over time as ongoing investigations may result in an arrest or summons at a later stage.
6.10 Victim reports
In the year ending 31 December 2016, there were 7,788 recorded victim reports with a sexual offence principal offence. This represented an increase of 18.3 per cent (n=1,207) from the year ending 31 December 2015.
Of the 7,788 victim reports, 79.7 per cent (n=6,204) involved a female victim while 18.8 per cent (n=1,467) involved a male victim. The remaining victim reports involved a victim with an unknown sex.
The highest age group for female victims was 15–19 years (n=1,496) followed by 10–14 years (n=1,026). Female victims aged under 30 years made up 69.7 per cent of all female victims (n=4,326).
Of the 1,467 male victims, the highest age groups were 10–14 years (n=284) and 5–9 years (n=228). Proportionally, male victims aged between 5 and 19 years made up 47.6 per cent of all male victim reports (n=698). Female victims were slightly older, with a similar proportion of 52.6 per cent aged between 10 and 24 years (n=3,266).
Victim reports by sex and age, January to December 2016

Of the 7,788 victim reports 34.3 per cent were recorded with a relationship of Non family member (n=2,670) and a further 22.8 per cent were recorded with a relationship of Family (n=1,779). Victim reports where the relationship was Not known to victim made up 19.5 per cent, and Current or Former partner 13.7 per cent.
The proportions of relationship type for male and female victims were relatively similar, with Non family member making up the highest proportion for both male and female victims (42.6 per cent and 32.6 per cent respectively). Current or Former partner made up a higher proportion for female victims (16.7 per cent) compared to male victims (2.1 per cent), and male victims recorded a higher proportion of Family (28.6 per cent) in comparison to female victims (21.6 per cent).
2 The category 'Other' includes complaint withdrawn, notice to appear, no offence disclosed, offender processed, warrant issued, summons not authorised and other statuses.
![]() These link(s) will open in a new browser window.
These link(s) will open in a new browser window.
 This work is licensed under a Creative Commons Attribution 4.0 International License (External link).
You may need Adobe® Acrobat® Reader or Libre Office to view the document(s) on this page.
Get Adobe® Acrobat® Reader (External link)
Get Libre Office (External link)