This spotlight presents data on burglary/break and enter offences as recorded by Victoria Police in the Law Enforcement Assistance Program (LEAP) database during the ten years to December 2018.
Burglary/break and enter offences have decreased in the past ten years, with the year ending December 2018 recording the lowest volume since July 2004. A data visualisation has been produced along with this spotlight, it provides access to the Burglary/break and enter offence characteristics highlighted in this spotlight for all 79 Victorian local government areas.
Burglaries are defined as any recorded offence that has been coded to the CSA offence classification category “B30 Burglary/Break and Enter”, this includes the following offence subgroups:
- B311 Residential aggravated burglary
- B312 Non-residential aggravated burglary
- B319 Unknown aggravated burglary
- B321 Residential non-aggravated burglary
- B322 Non-residential non-aggravated burglary
- B329 Unknown non-aggravated burglary
Definitions for the above listed classifications can be found in the CSA offence classification located in the ‘About the data (External link)’ section at www.crimestatistics.vic.gov.au (External link).
Data are presented for recorded offences based on crime recorded by Victoria Police during the ten year period from January 2009 to December 2018. Data for this spotlight were extracted from the Victoria Police LEAP database on 18 January 2019.
The primary measure of recorded crime featured in this spotlight is the offence count except for the number of property items stolen. Offence count represents every instance that an alleged violation of criminal legislation has been recorded by Victoria Police in the LEAP database.
Recorded Offences
In the year ending December 2018, there were 40,397 Burglary/Break and Enter offences recorded. The number of recorded offences decreased 11.3% (5,149 offences) when compared to the year ending December 2014. A Kendall’s Rank Order Correlation statistical test (or Kendall’s tau-b) was conducted on the number of offences over the 24 months ending December 2018 and it confirmed a significant downward trend for this offence subdivision.
Legislative Changes
In December 2016, the Crimes Act 1958 was amended to create new offences for Home invasion (section 77A) and Aggravated home invasion (section 77B). To classify home invasion offence types to the CSA Offence Index the most serious aspect of the offence code recorded is used. This results in these offence types appearing in two CSA offence groups A21 Serious assault and B31 Aggravated burglary. Home invasion offences that include serious injury to a person are classified as A21 Serious assault. The following offence codes are classified to A21 Serious assault:
- 310AD - Home invasion (assault) - with firearm
- 310AF - Home invasion (assault) - offensive weapon
- 310AE - Home invasion (assault) – imitat/n firearm
- 310AR - Aggravated home invasion (assault) - with firearm
- 310AS - Aggravated home invasion (assault) - imitation firearm
- 310AT - Aggravated home invasion (assault) - offensive weapon
- 310Q - Home invasion (assault) - person present.
In the current reference period, 87 home invasion offences were recorded under A21 Serious assault and are therefore not included in this spotlight, while 105 were recorded under B31 Aggravated burglary and are included in totals in this spotlight. For more details visit the explanatory notes (External link) on the CSA website.
Trends over Time
Burglary/break and enter offence volume has decreased from 45,957 in 2009 to 40,397 in the current reference period. The year ending 2018 recorded the lowest count in CSA data holdings, which go back to July 2004. This decrease is not consistent over the ten year period, with the highest recorded volume in ten years observed in 2016 (54,755 offences). Since the peak in 2016, the offence volume has seen decreases of 15.5% (8,462 offences) and 12.7% (5,896 offences) in 2017 and 2018 respectively.
Burglary/break and enter offences recorded in Victoria, January 2009 to December 2018

In the year ending December 2018, offences at residential premises comprised more than two thirds of all burglary/break and enter offences (67.5%) followed by those at non-residential premises (32.3%), as shown in the figure below. These proportions have remained relatively stable over the last ten year period.
Composition of burglary/break and enter offences, January to December 2018

Note: In the figure above the term “Agg” refers to Aggravated offences while “Non-Agg” refers to Non-Aggravated offences.
Day of the Week and Time of Day
Weekends made up 28.3% of the 40,397 offences recorded in the period ending December 2018. The highest proportion of offences were committed on a Friday (17.2% or 6,960 offences) followed by Saturday (14.8% or 5,971 offences) and Thursday (14.1% or 5,706 offences).
The figure below shows that the majority of residential burglary/break and enter offences during 2018 were committed during the day, with 33.9% of offences committed from midday to 5:59pm. The time period midnight to 5:59am recorded the lowest proportion of residential offences (14.2%).
For non-residential burglary/break and enter offences, the time slot from midday to 5:59pm also made up the largest proportion (31.3%) followed by 6pm to 11:59pm (29.9%).
Burglary/break and enter offences by time of day, January to December 2018

Note: Commit from time is the earliest possible time the offence may have occurred, as recorded by Victoria Police.
For local government area breakdown of day of the week and time of the day data, see the attached data table.
Characteristics of Residential Burglary/Break and Enter Offences
In the year 2018, the most common entry point recorded for residential burglaries was Door (40.9% of entry points, 15,139 offences), followed by Window (17.1%, 6,328 offences). Rear/Back and Front were the next most common entry points with respective proportions of 14.8% (5,474 offences) and 8.4% (3,115 offences).
Entry points used in residential burglaries, January to December 2018

Note: Other includes ground floor – multi storey, other floor – multi storey, floor and other entry points.
For local government area breakdown of the entry points used in residential burglaries, see the data visualisation.
The following chart shows the methods of entry used in residential burglaries in the year ending December 2018. Forced/Broke Door had the highest proportion, with 23.6% of entry methods (7,526 offences), followed by Unlocked/Open Door (13.7% or 4,376 offences). Approximately one in nine residential burglaries had no sign of forced entry (3,795 offences).
Building entry methods used in residential burglaries, January to December 2018

Note: Other includes unlocked/open window, key used, remove louvre/window, bypassed security measure, cut hole, remove roof tile/iron, unscrew hinges, invited in and other entry methods.
For local government area breakdown of the residential burglary building entry methods, see the data visualisation.
The figure below presents the proportion of entry methods for aggravated and non-aggravated residential burglaries in 2018. The most common method of entry in aggravated burglaries was Unlocked/Open Door at 28.7% of entry methods followed by Forced/Broke Door at 16.1%. The proportions were considerably different for non-aggravated burglaries, where Forced/Broke Door formed the bulk of entry methods at 24.6%, followed by Forced/Broke Window at 13.1%.
Building entry methods in aggravated and non-aggravated residential burglaries, January to December 2018

Note: Other includes unlocked/open window, key used, remove louvre/window, bypassed security measure, cut hole, remove roof tile/iron, unscrew hinges, invited in and other entry methods.
In residential burglary/break and enter offences recorded in the period ending December 2018, Physical force was the most common tool used, accounting for 28.8% of tools or 7,885 offences. Nil visible force made up 25.7% of tools used (7,049 offences) and Jemmy/screwdriver accounted for 16.0% (4,387 offences) of tools used within residential burglaries.
Tools used in residential burglaries, January to December 2018

Note: Other includes stillsons/multi-grips, glass cutters, coat hanger/nylon tape, oxy/explosives and other tools.
For local government area breakdown of tools used in residential burglaries, see the data visualisation.
Property Items Stolen
The graph below shows the top categories of property items stolen in burglaries over the last ten years.
Top five property items stolen in burglary/break and enter offences, January 2009 to December 2018

Jewellery was the most stolen item in burglary/break and enter offences. The number of jewellery items stolen decreased 41.1% from 39,356 in 2009 to 23,200 in 2018. Electrical appliances, personal property and cash/documents have also shown a decrease of 55.3%, 42.2% and 23.4% respectively. The property items making up the top five have remained relatively stable during the last ten years.
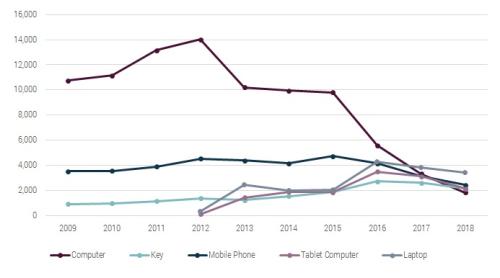
The following graph presents select property items stolen within burglary/break and enter offences over the past 10 years. The most noticeable change is the drop in the number of computers recorded as a stolen property item computers, this peaked with 14,009 items in 2012 before dropping to 1,834 items in 2018. The recording of tablet computers and laptops separately from computers began in 2012 and this may explain some of the drop in number of computers stolen in the following years. The number of stolen mobile phones remained relatively stable over the 10 year period while the number of keys showed an increase.
Select property items stolen in burglary/break and enter offences, January 2009 to December 2018
For local government area breakdown of the property items stolen in residential burglaries, see the accompanying data visualisation.
Geographical Location
Approximately two thirds of local government areas recorded a decrease in burglary/break and enter offences from the year ending December 2014. Benalla, Buloke, Melbourne, Mount Alexander and West Wimmera were the only local government areas that recorded a higher proportion of non-residential burglary/break and enter offences in the current reference period.
The table below shows the local government areas that make up the five highest offence counts in the current reference period.
Top 5 local government areas by offence volume, January 2014 to December 2018

The top five above has remained consistent over the past five reference periods with Greater Geelong recording the highest burglary/break and enter offence count every year for the past five reference periods.
The table below takes population figures into account and shows the local government areas that have the five highest offence rates per 100,000 in the current reference period.
Top 5 local government areas by offence rate per 100,000 population, January 2014 to December 2018

The top five local government areas based on rate per 100,000 population have also remained relatively stable over the past five years, with Yarra and Greater Shepparton appearing in the top five for every year over this period.
The map below shows the rate of burglary/break and enter offences per 100,000 population by local government areas in the period ending December 2018.
Rate per 100,000 of burglary/break and enter offences by local government areas, January to December 2018

For local government area breakdown of historical trends, offence characteristics and items stolen in residential burglaries, see the accompanying data visualisation.
Conclusion
The year ending December 2018 saw the lowest number of burglary/break and enter offences recorded since July 2004. In summary, a decrease in volume is observed for burglary/break and enter offences when comparing the year ending December 2009 to the current reference period (down 12.1% or 5,560 offences). The decrease over the past 10 years has not been consistent for this offence type, a peak in recorded offences was observed in 2016. Throughout this 10 year period residential burglaries consistently made up nearly two thirds of burglary break and enter offences.
This spotlight found that ‘Door’ was the most common entry point for residential burglaries, with ‘Forced/Broke Door’ being the most recorded residential burglary method of entry.
Characteristics of burglary/break and enter offences have been explored in this spotlight, both at a state level in the commentary and at a local government area level in the data visualisation.
Data Visualisation
The data visualisation below provides a breakdown of the burglary/break and enter content explored in the commentary for all 79 Victorian local government areas.
![]() These link(s) will open in a new browser window.
These link(s) will open in a new browser window.
You may need Adobe® Acrobat® Reader or Libre Office to view the document(s) on this page.
Get Adobe® Acrobat® Reader (External link)
Get Libre Office (External link)